Long-term trends
The long-term trends section has a number of charts that span multiple months or even years to show you how you are trending over time. This is a feature that’s also available to Basic Free subscribers - the same charts you know and love from CB Explorer just with an extended 4 months time frame. Active subscribers get even more, the duration is only limited by how much data we have for you.
info
After you sign up and configure your Chaturbate room name it may take up to 24 hours to backfill trends data with daily ranking, viewership and follower changes.
The following charts are available to everyone, including Basic Free users:
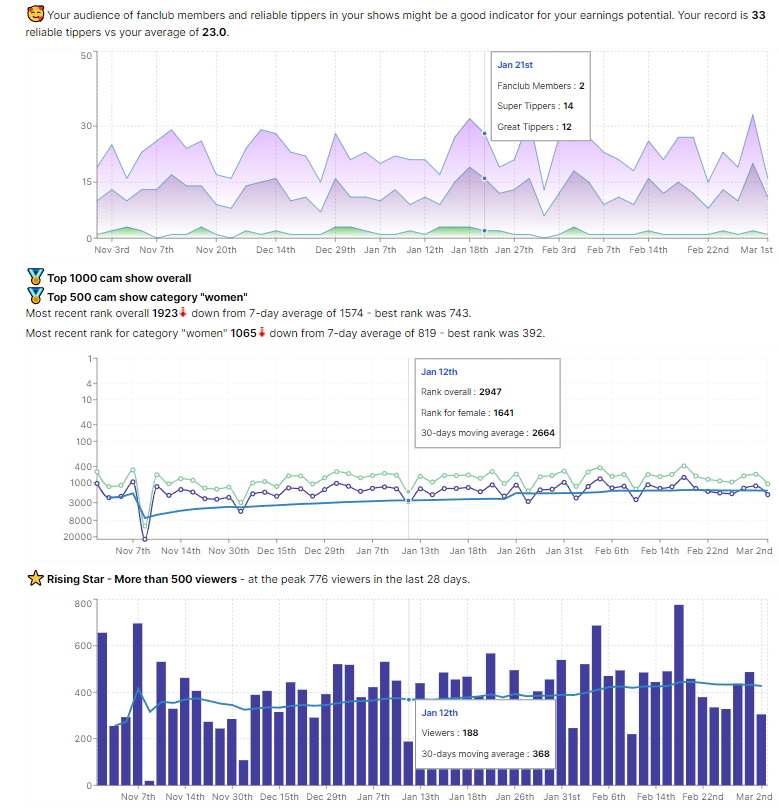
- Rankings, overall and for gender
- Viewers
- Followers overall and followers gained by day
- Follower rank and follower growth rank
These charts are updated once daily, so depending on when you look at them they might not reflect your most recent cam session or ranking yet.
Two additional charts are only available to active subscribers:
- Viewers vs token earnings
- Reliable tippers over time - all tippers that are either fanclub members, great tippers or super tippers.
These charts are updated dynamically, so should always be up to date.
All charts are synced - when you hover over a data point, all other charts will highlight the corresponding data point on the same day.
Many of the charts support a trendline, by default that is a 7-day moving average, but a 30-day moving average is available too, and additionally for active subscribers there is a 90-day moving average and a simple average.
tip
Trendlines can be useful to see how your chart is changing over time and what you “usually” achieve, they move much slower and more consistently than any one day change, e.g. if your 30 day average for follower gains is 200 but you gained more than 300 followers in a broadcast, you know it’s stellar!