Cam Session Details
Aggregate Stats
Each cam session detail view shows a number of aggregate stats for the broadcast on top:
Duration: the broadcast duration in hours/minutes.
Viewers: the maximum number of viewers you had (including unregistered viewers).
Reach: the number of unique registered viewers (no greys ) with tokens you had in your room. We take a snapshot of your viewers roughly every 10 minutes to calculate this.
Tip Tokens: The tokens you received from tips.
Income: Your income (in USD).
Followers: How many followers you gained during the broadcast
Purchases: How many purchases were made during the broadcast
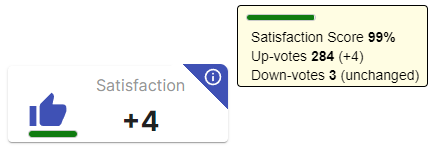
Satisfaction: satisfaction votes cast during the broadcast - this number is the “up” votes minus the “down” votes made. You can see more details for your current satisfaction score by hovering over the info icon in the upper right corner. Satisfaction is only displayed if there was an actual change.
Tip, Tipper and Purchase stats
Underneath the aggregate stats is a section with detailed stats for tippers, returning fans, purchases and your tip menu. By default the tab with your tippers is shown.
Clicking on any tipper’s name in the tippers or true fans tabs shows the tip history for that tipper.
Tipper history details
When a tipper is selected, a dialog shows up with history you had with that tipper. There are six different tabs with details ranging from tips, your tip menu, past chat interactions, their daily schedule, presence in your cam sessions and notes.
tip
You can access all this information about tippers also outside cam session details. A call out specifically here for the tipper search and the tips overview.
Basically whenever you see a tipper name, click on it to get their details.
Tips
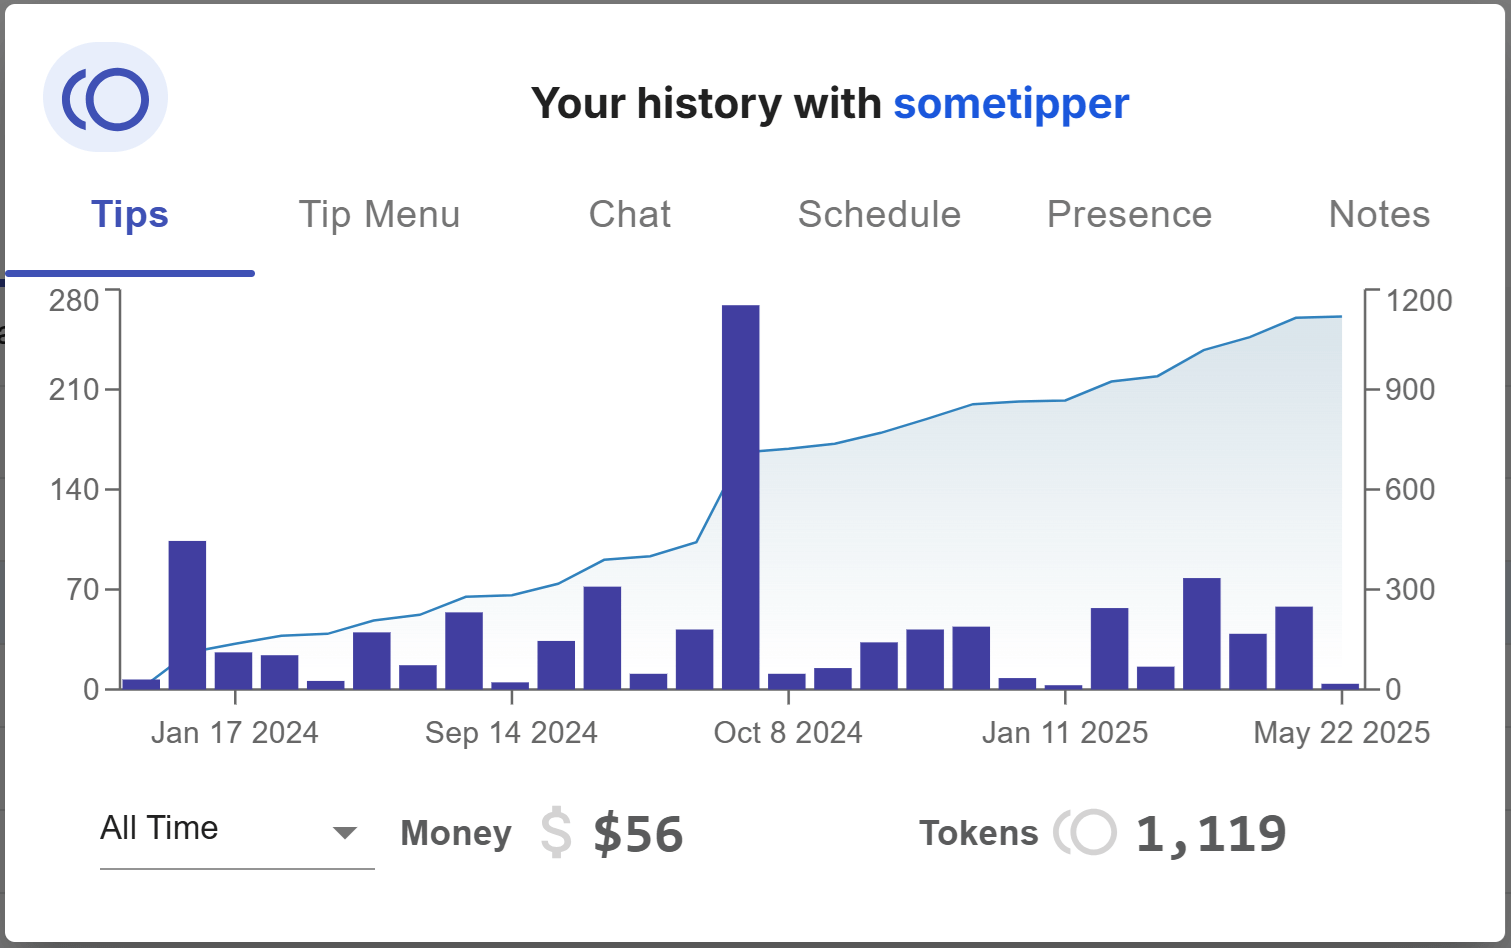
The tips you received from this tipper over time, amounts are grouped by day. By default you will see tips over all time, but there's a filter that allows you to select a narrower time frame - either 30 days, 90 days or over the last year.
Tip Menu
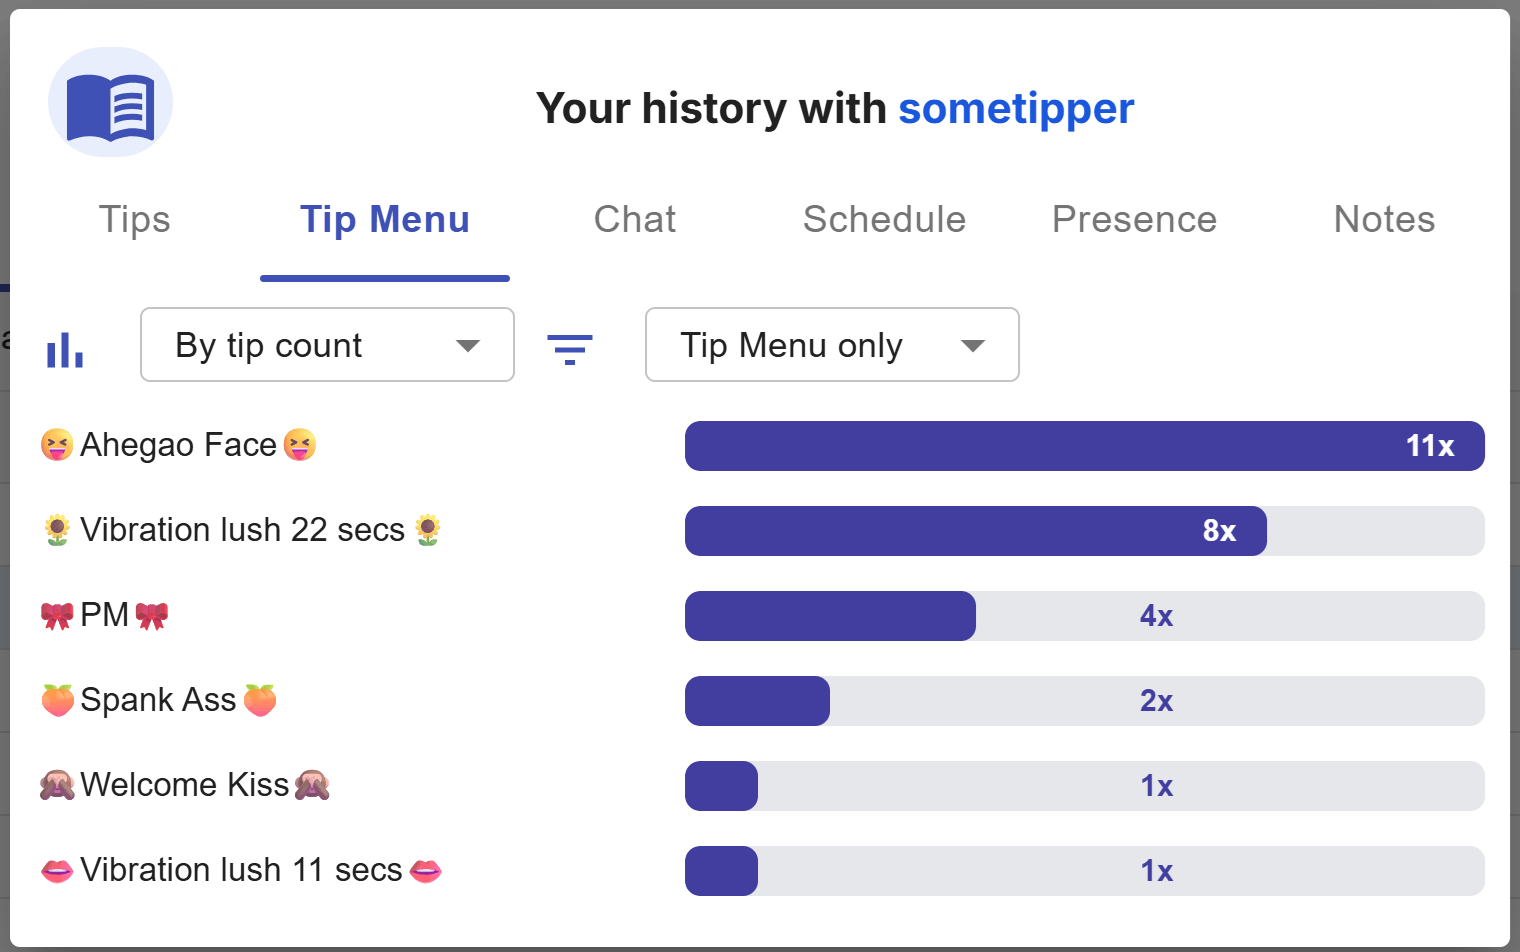
Shows what tip menu items this tipper tipped for and how often. There is a filter to toggle between tip menu items, other tips or both, so you still get an idea of the tip distribution even if you don't have a tip menu configured or the tipper you're looking at didn't use those tip menu items. You can toggle between tip count (how many times did they tip for each item) and tip amount (the times they tipped x the tip amount the item is worth).
The list will display the top 10 items at most, and you may have to scroll down to see all items.
tip
To make the most out of this feature you will definitely want to configure your tip menu on CB Cam Insights.
Chat
All the tipper's past chat interactions with you.
Schedule
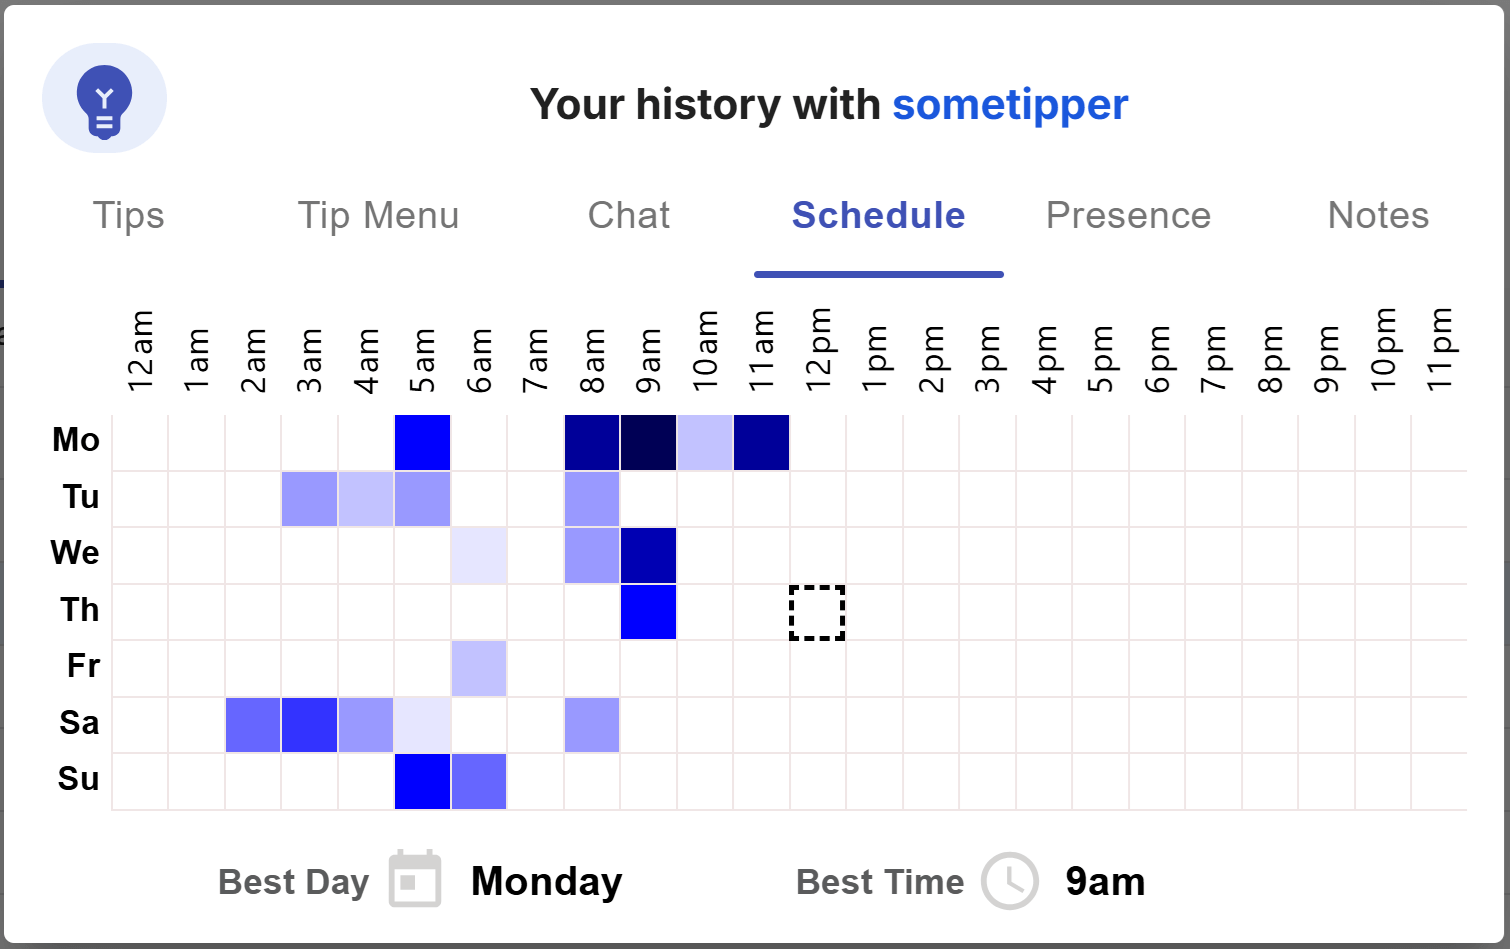
The schedule tab shows a heatmap on what days and times a tipper tipped you - looking at it, it should be clear when to expect this tipper in the future in your cam sessions and it might also help you tweaking your schedule to accomodate them.
Presence
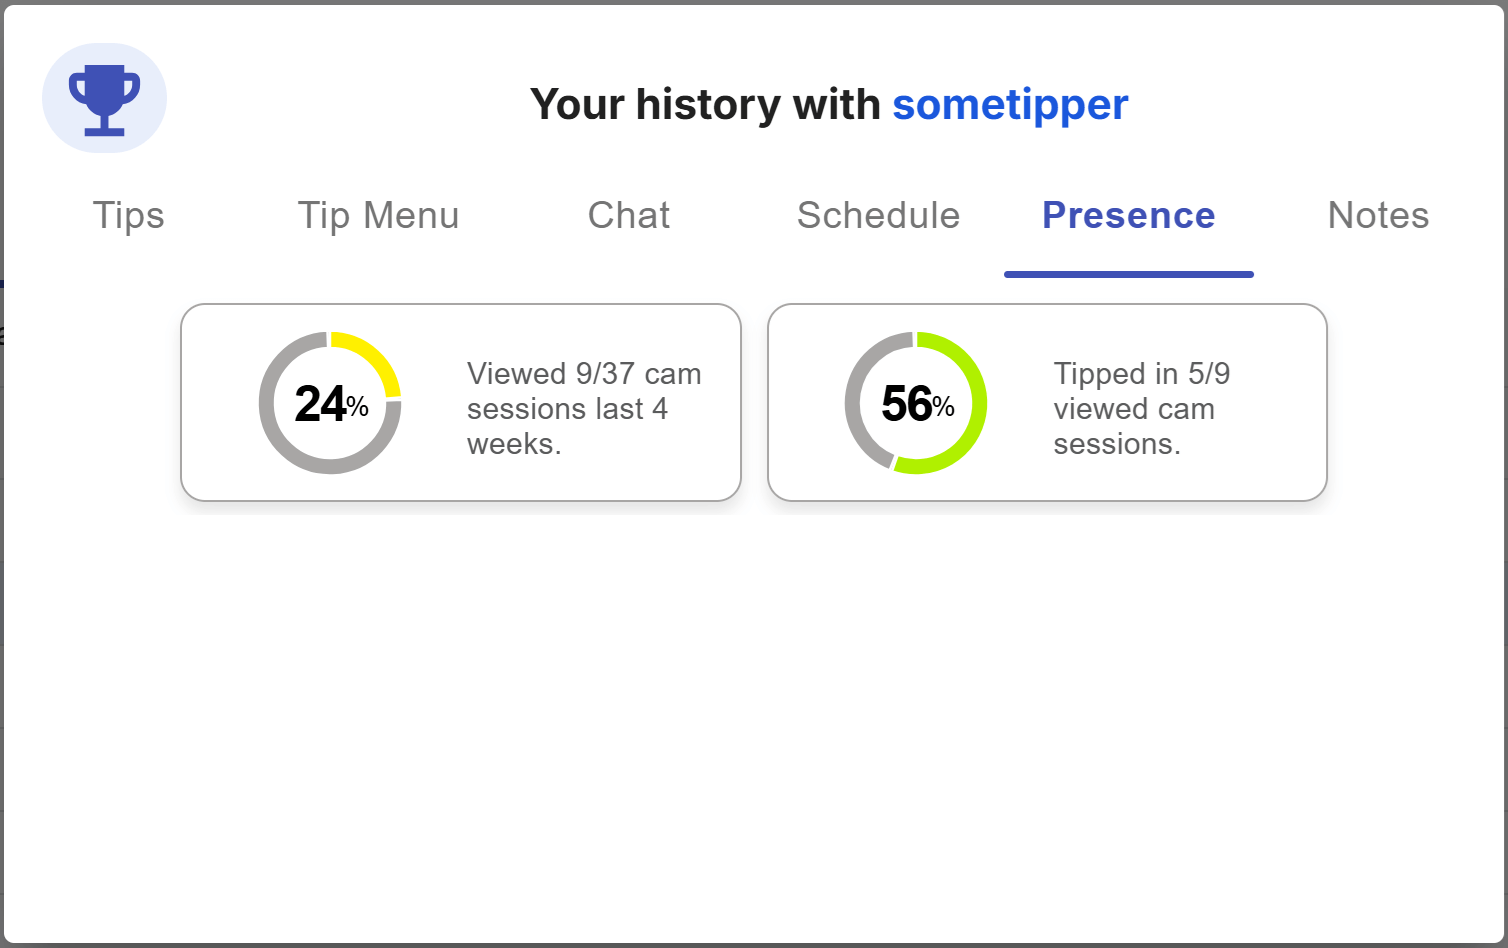
The presence tab shows you how many cam sessions of yours the tipper attended over the last four weeks, and of those they attended how many they actually tipped in.
These data points are a good indicator on how dedicated a tipper is to you and your room.
Notes
You can give a rating for this tipper here (1-5) and write down some important notes so that you have them handy for a conversation with them.
tip
You can import all of your tipper notes from Chaturbate into CB Cam Insights so that they show up in the notes tab via the CB Cam Insights Chrome extension.
Tippers
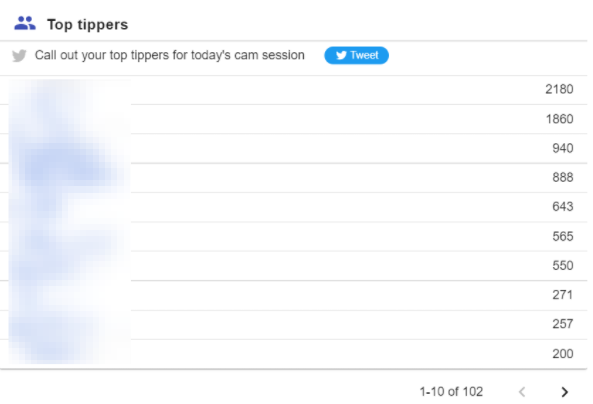
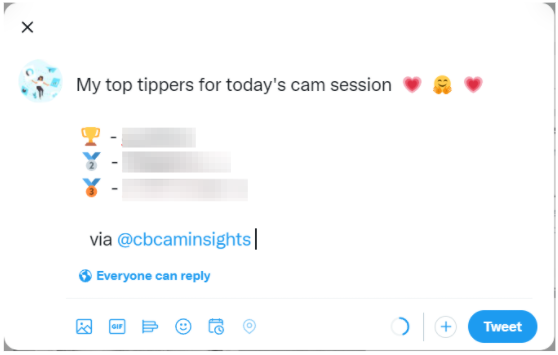
A list of your tippers for this broadcast, ordered by token count descending. There’s a tweet button on top that allows you to quickly tweet the top 3 tippers for the cam session.
True Fans
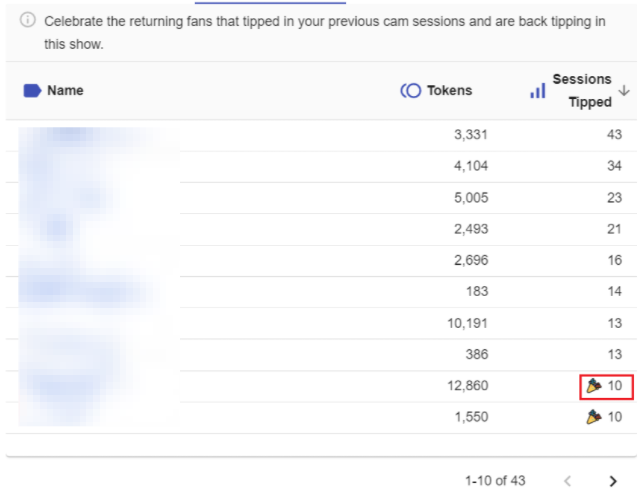
For each viewer in your broadcast displays the number of tokens they have tipped you overall and the number of cam sessions they have tipped in.
This gives you an opportunity to call out milestones as certain cam session counts (5, 25 and any multiple of 10) are displayed with a 🎉 symbol.
Purchases
Displays the item name, token count, number of times purchased and aggregate token count for all purchased items.

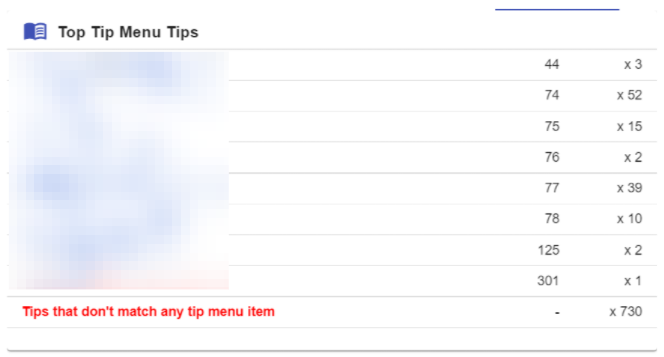
Tip Menu
Displays the tip menu item name, token count and number of times this token count was tipped.
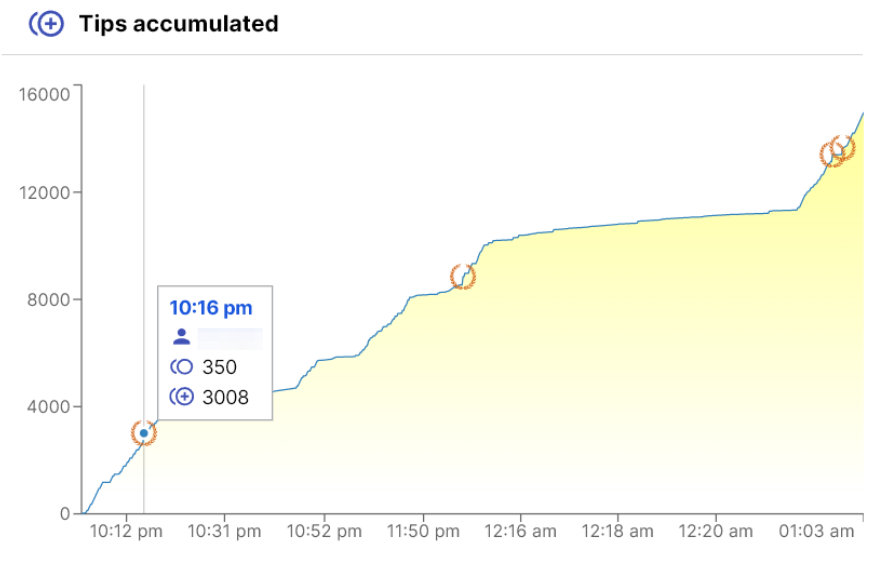
Tips over time
The Tips accumulated widget gives you an overview how your broadcast progress in terms of tips. The higher the slope of the graph, the more you were tipped during that time period. The top 3 tips (by tip amount) are called out with a laurel wreath.
The hover tooltip shows the time, tipper name, amount and tip amount up to this time in the broadcast.
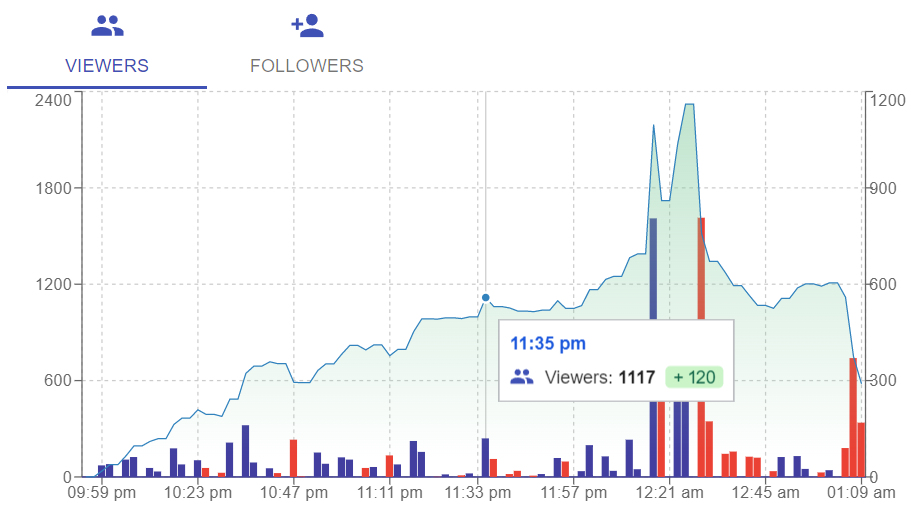
Viewers and Followers
The Viewers and Followers widget gives you an overview how your broadcast progressed in terms of viewers and new followers.
The Viewers chart shows the number of viewers in your broadcast in roughly 2 minute intervals.
The hover tooltip shows the time, viewer count and delta compared to the previous data point.
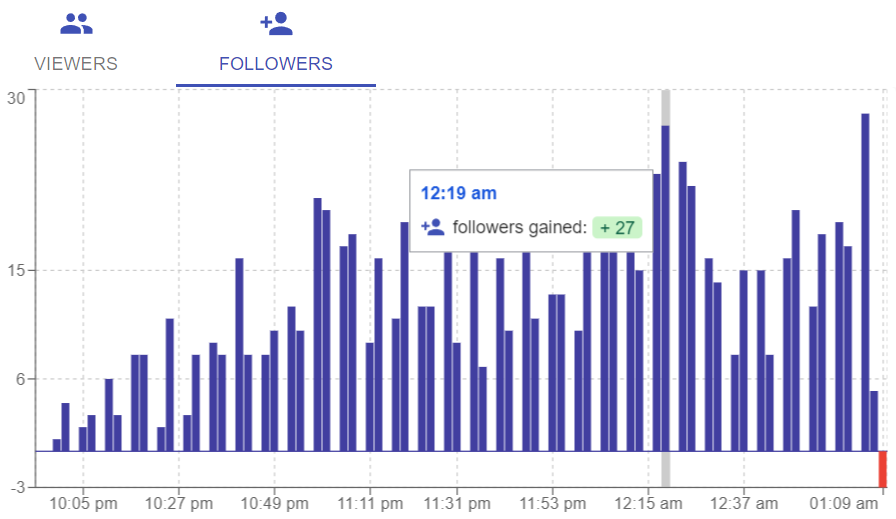
The followers chart shows the number of followers you gained during your broadcast in roughly 2 minute intervals. The hover tooltip shows the time, number of followers gained (or lost) and delta compared to the previous data point.
Hashtag distribution
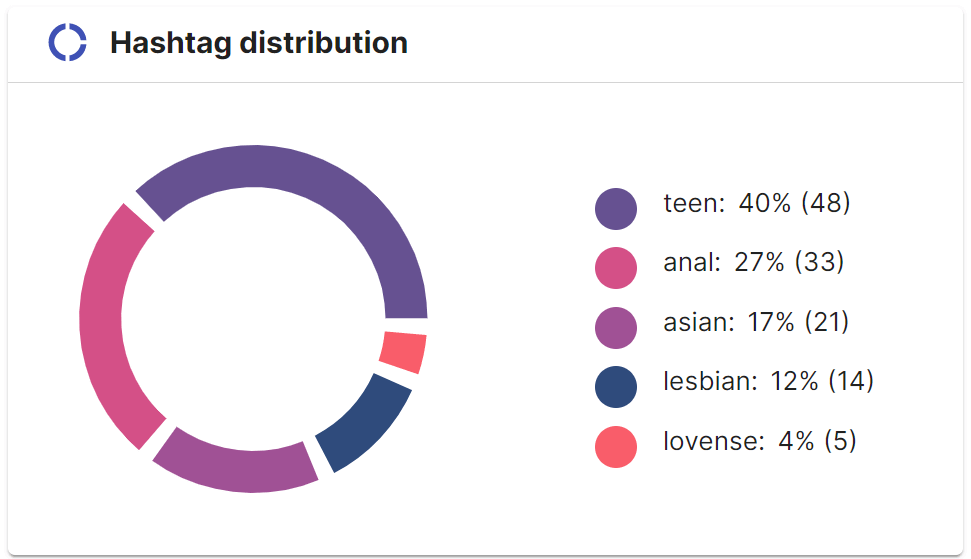
The Hashtag widget gives you an overview from what hashtags your viewers joined your room from. This info will only be available if you configured and used the CB Cam Insights chrome extension for this cam session.
tip
A good approach is to keep your most successful hashtags and experiment with the ones not driving any viewers to your room - you might discover an even better one!
Tip Distribution
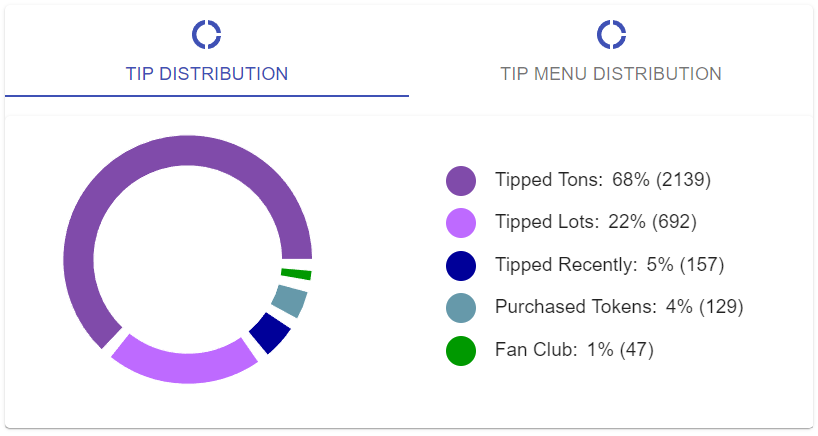
The Tip Distribution widget gives you an overview from what type of viewer your tips were coming from.
Tip Menu Distribution
The Tip Menu Distribution widget gives you an overview of what tip amounts were popular in your cam session - if the tip amount is associated with a tip menu item, the name of the item will show up here.
Insights
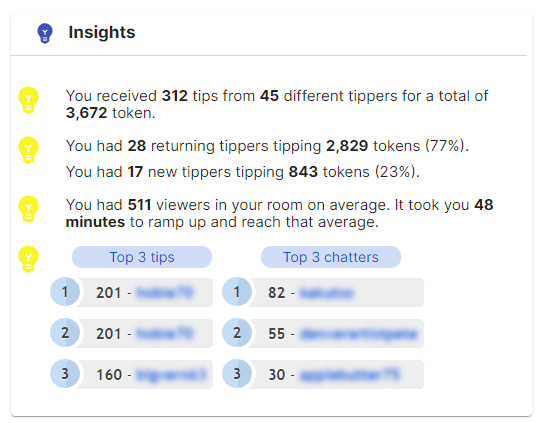
The Insights widget gives you some key insights for your cam session:
- How many individual tips did you get
- How many different tippers tipped you for what total amount
- What is the tip distribution between new and returning tippers
- What is your ramp-up time until you reached your room average viewership
- What were your top 3 tips by tip amount for the cam session
- What were your top 3 chatters for the cam session
Chat Interactions
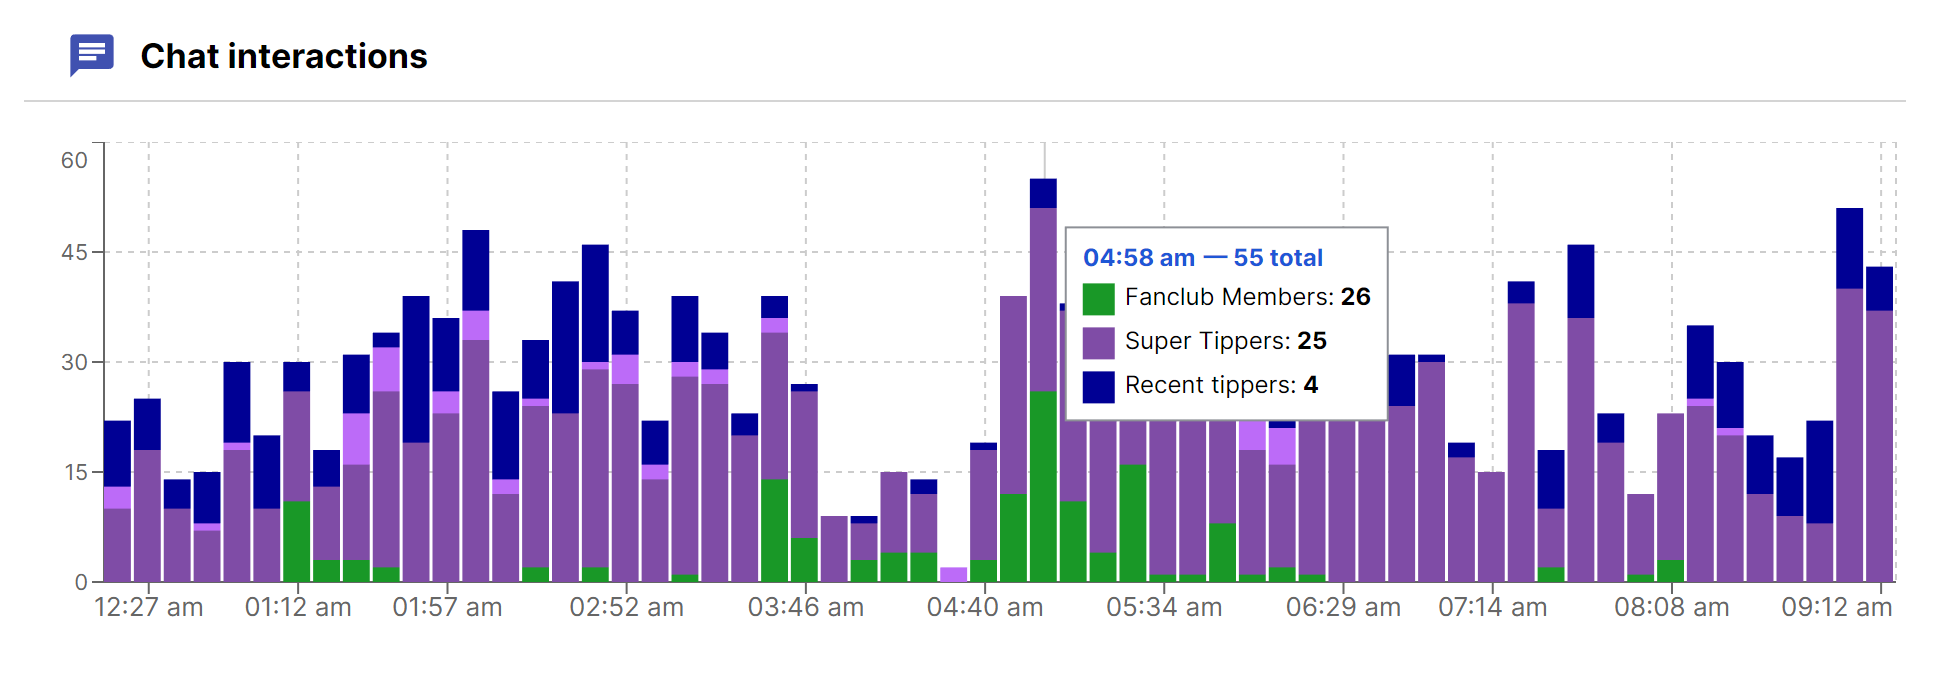
The chat interactions chart has a breakdown of all chats in your room - see when your room is most engaged and what viewers contribute the most to the conversation. Viewer types are color coded in the same way as in the session overview (see below).
You can leverage the chat interactions history to give you insights into engagement - do more of what causes engagement to spike and your room interested!
Session Overview
The Session overview widget shows you tips, purchases and traffic over time all in one chart. Tips and purchase tokens are stacked in ~5-7 minute update intervals to show you what tips & purchases were made in that time frame.
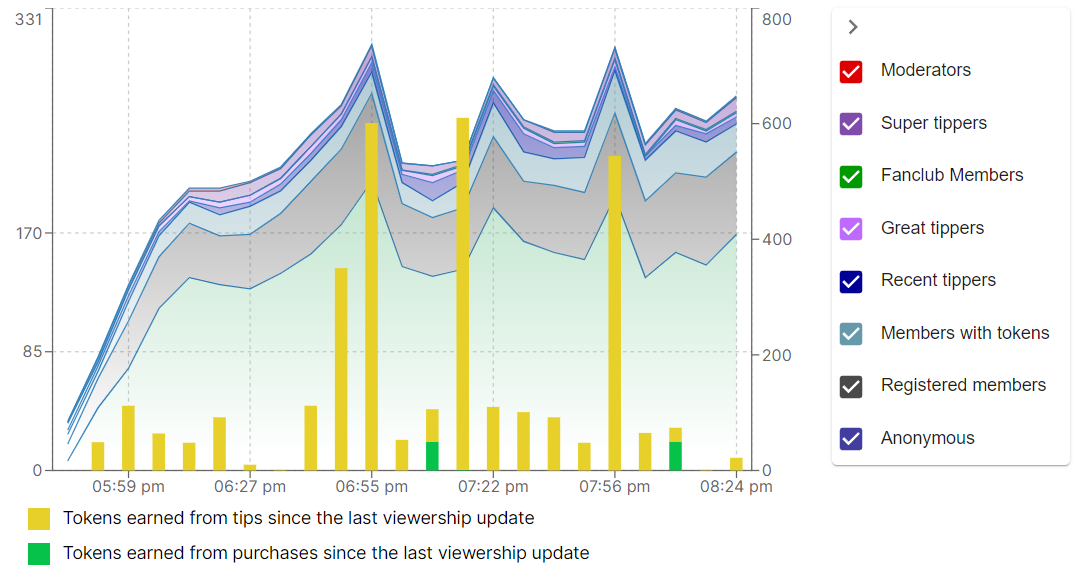
You can filter the viewers that are included in the chart by checking or unchecking their status on the right - the colors follow the same convention that Chaturbate applies for your room chat - they indicate the user status or how many tokens they have tipped:
Orange names are broadcasters
Red names are moderators
Green names are fan club members
Dark Purple names have tipped at least 1000 tokens in the past 2 weeks
Light Purple names have tipped at least 250 tokens in the past 2 weeks
Dark Blue names have tipped at least 50 tokens in the past 2 weeks
Light Blue names own or have purchased tokens
Grey names have no tokens
Notes
The Notes widget allows you to take notes that will remain associated with this cam session. This can be useful to keep details on what made this cam session special or keep a track of what worked and what didn’t so you don’t forget.
