Overview dashboard
The overview dashboard gives you a broad overview over how your cam business is going - data points on this dashboard are by day - if there were multiple broadcasts on a day, they are combined into one data point (e.g. earnings would be combined, max viewers over all broadcasts for that day).
info
The overview dashboard can be found under Dashboard in the side menu.

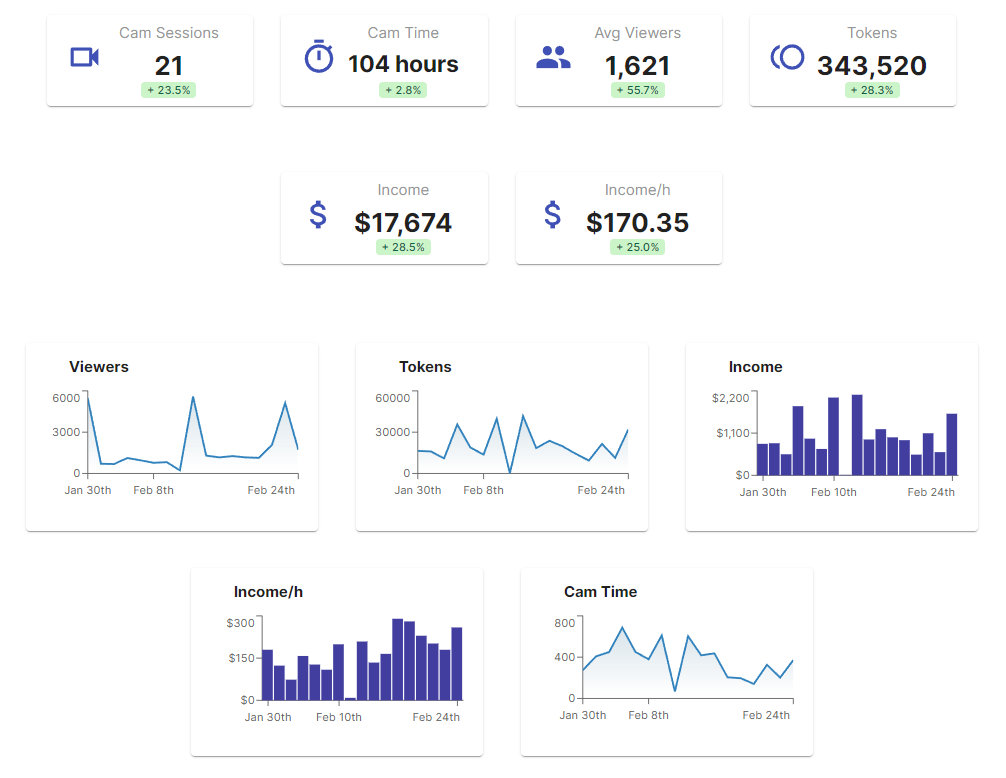
Aggregate stats and comparisons
The dashboard displays a number of aggregate stats over the time period you select either with the quick filter or directly via a date range. The percentage of gains/losses displayed are relative to the previous time period of the same duration, e.g. if you have selected “Last 7 days” it would compare to the 7 days before. One exception is “This month” where only the days in the current month are compared to the last full month - this can be great for goal setting and progress tracking.

The high level data points charted on this dashboard are for each day:
- Viewers: the maximum number of viewers you had.
- Tokens: the tokens you earned
- Income: Your income (in USD)
- Income/h: Your income per hour (in USD)
- Follower gain: The number of followers you gained
- Follower gain/h: The number of followers you gained per hour
- Affiliate income: Your affiliate income (in USD)
You can pick and choose which stats are interesting to you, use the filter widget under the date picker to unselect stats you are not interested in seeing on the overview dashboard.
To get data for your affiliate income in CB Cam Insights, you need to configure your Chaturbate Stats Token in your settings.
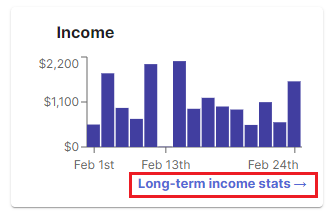
Long-term overview charts
Some of the charts allow digging deeper into a more long-term overview of the selected datapoint. Just hover over the chart with your mouse and click on the link displayed.
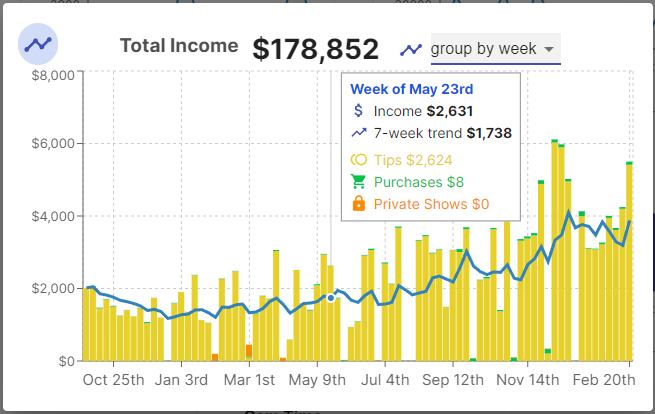
Total income
Linked from the Income overview chart gives you an overview of your income grouped by week or month and segmented by tips, purchases or private cam shows as the income source.
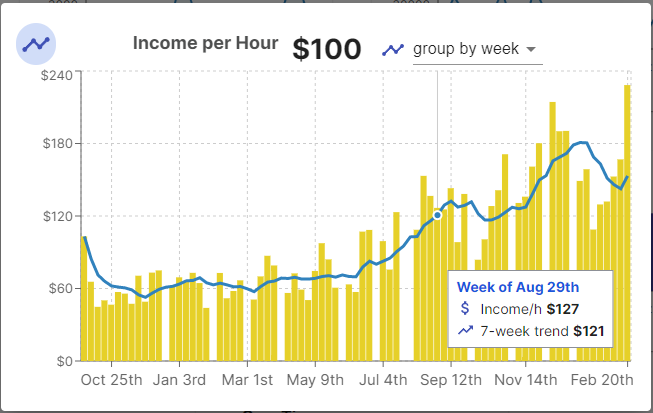
Income per hour
Linked from the Income/h overview chart gives you an overview of income per hour grouped by week or month.
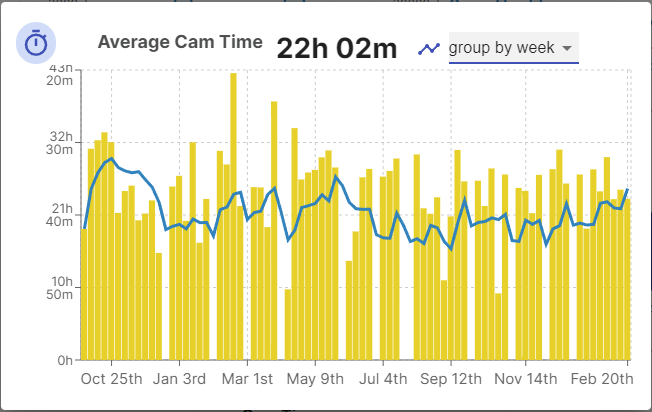
Average cam time
Linked from the Cam time overview chart gives you an overview of your cam time grouped by week or month.